case study
CARVANA.com
Carvana is the second largest auto retailer
in the United States. The company prides
itself on customer service and building
cool things– like car vending machines.

Challenge
BUILD TRUST through design
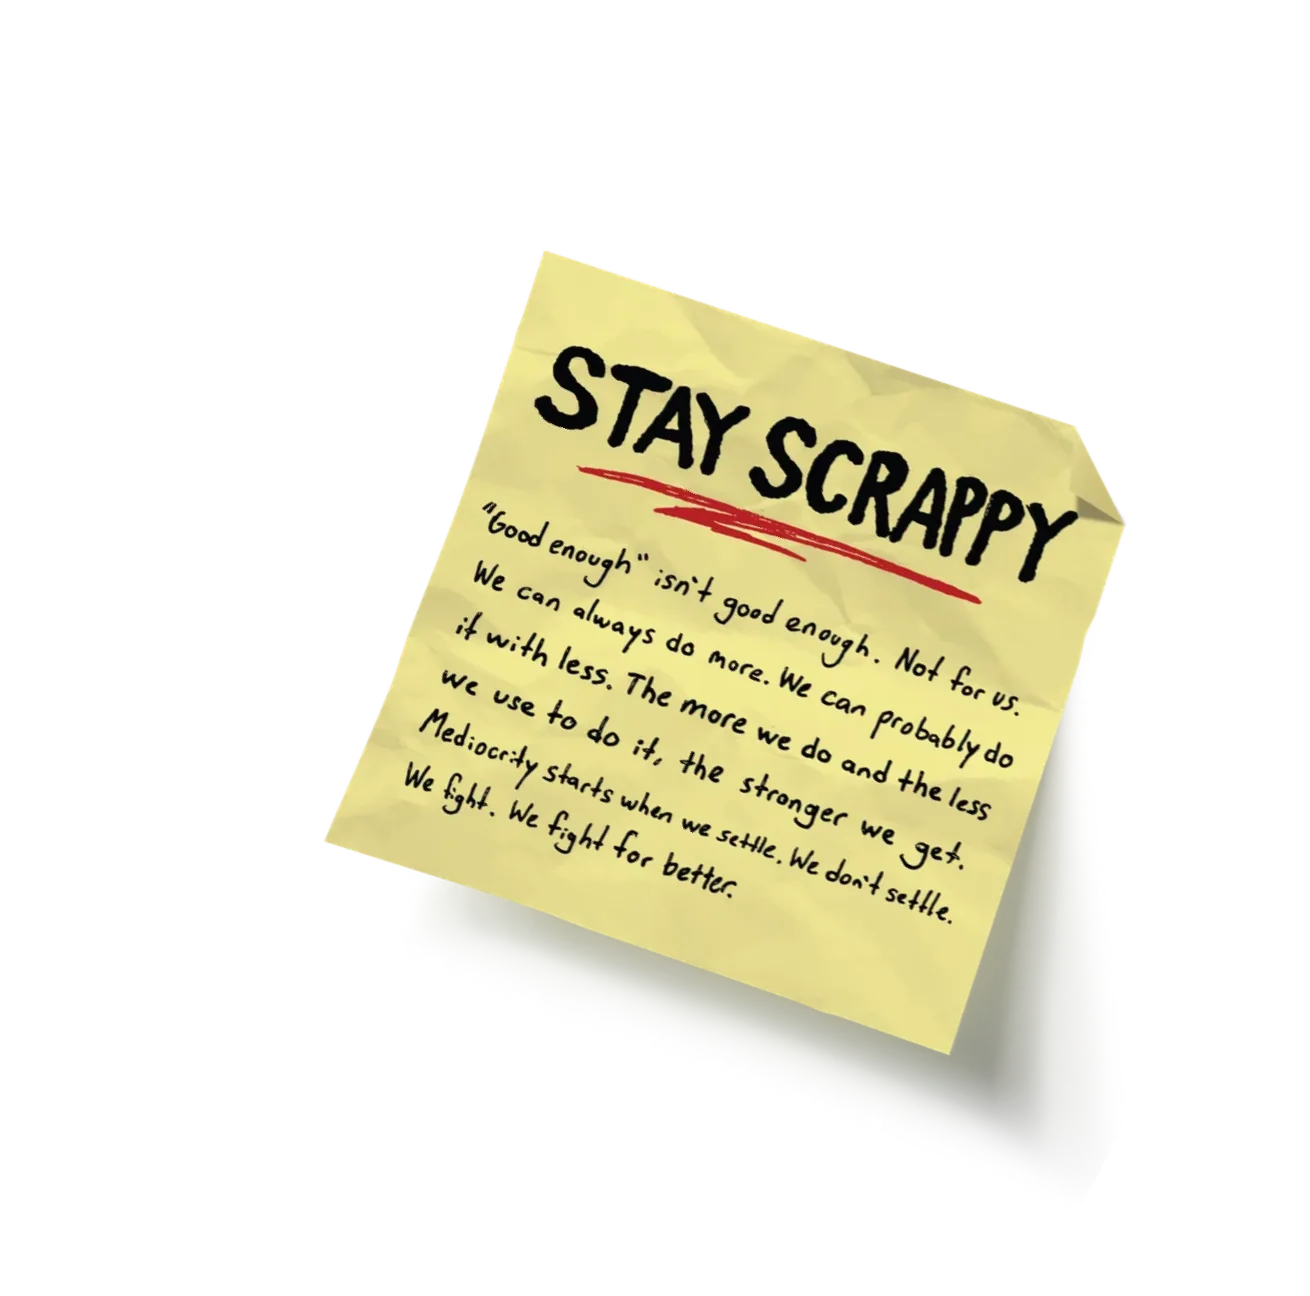
In 2017, buying a car online was still a novel idea, and Carvana’s site needed to earn consumers’ trust. Design also had to earn trust inside an engineering-led company. True to Carvana’s ‘Stay Scrappy’ value, our team of five had four months to do it.
SMALL TALK
What’s the fastest way to understand your user? Talk to them. To help the team empathize with Carvana’s users, I had the design team listen to inbound customer service calls. To my surprise, about 80% of callers also agreed to be interviewed afterward.
Our biggest takeaway was storytelling. Users lacked a narrative that simple data didn’t provide, and one request came up again and again: ‘help reassure me that I’m making the right choice.’
If I’m going to spend twenty thousand dollars buying a
car online I need to know that I can trust you guys.
– Ray
Plano, Tx
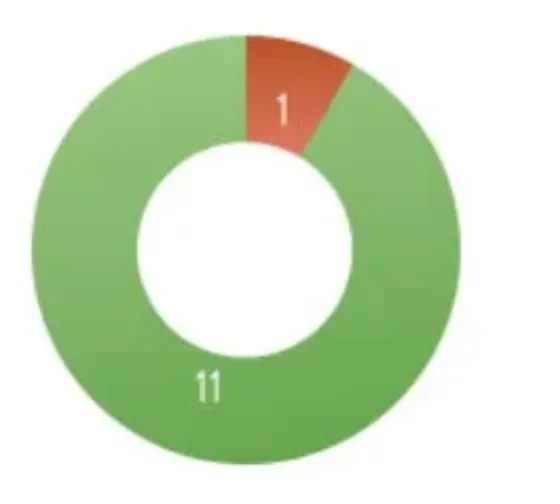
Through customer interviews, we learned that most of our users had some level of
familiarity with the car they were looking to purchase. Customers collect vehicle
knowledge through friends and family or researching the manufacturer’s website.
Test drove a similar vehicle
Where did they test drive?
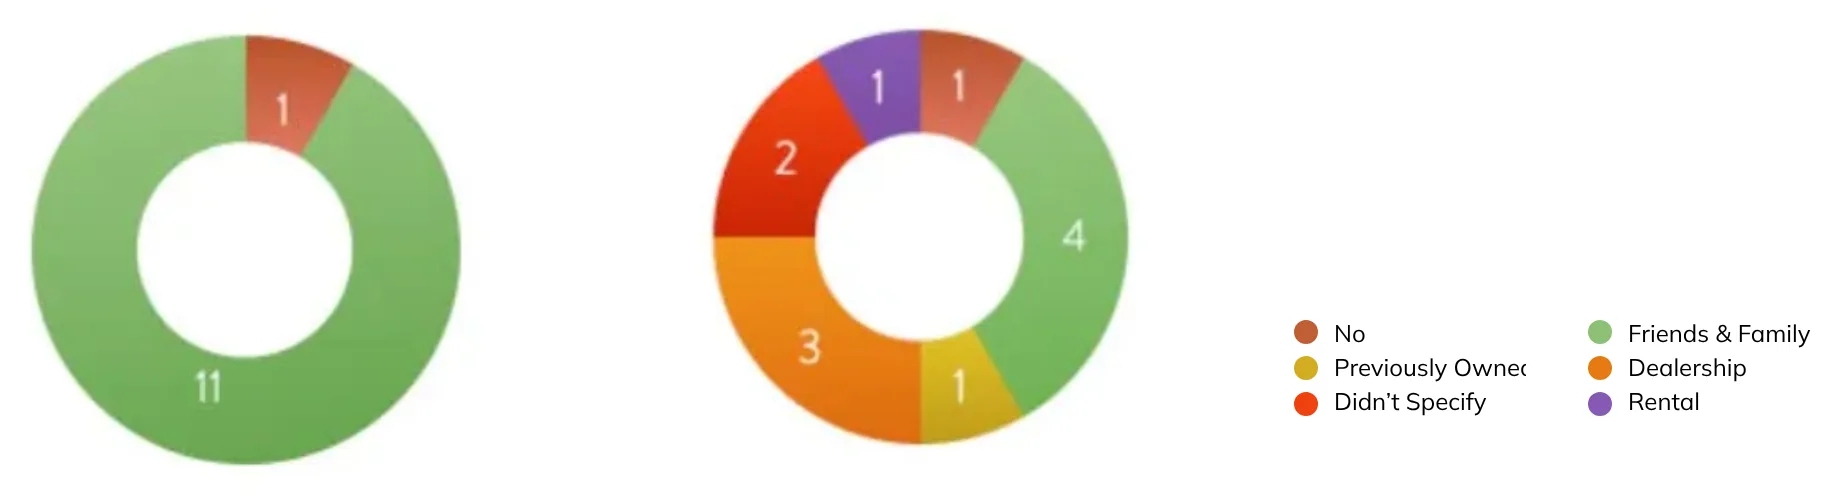
Test drove a similar vehicle
Where did they test drive?
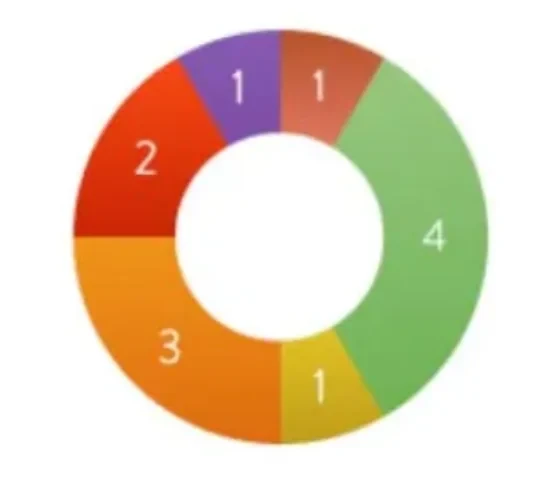
- No
- Friends & Family
- Previously Owned
- Dealership
- Didn’t Specify
- Rental
The team also interviewed key stakeholders within Carvana. A site redesign is a
massive undertaking that evokes a variety of feelings throughout an organization.
These internal conversations with cross functional teams allowed the design team to
get a better grip on the organization’s collective hopes and reservations. The
feedback was a mix of proposed architectural changes, marketing shifts and
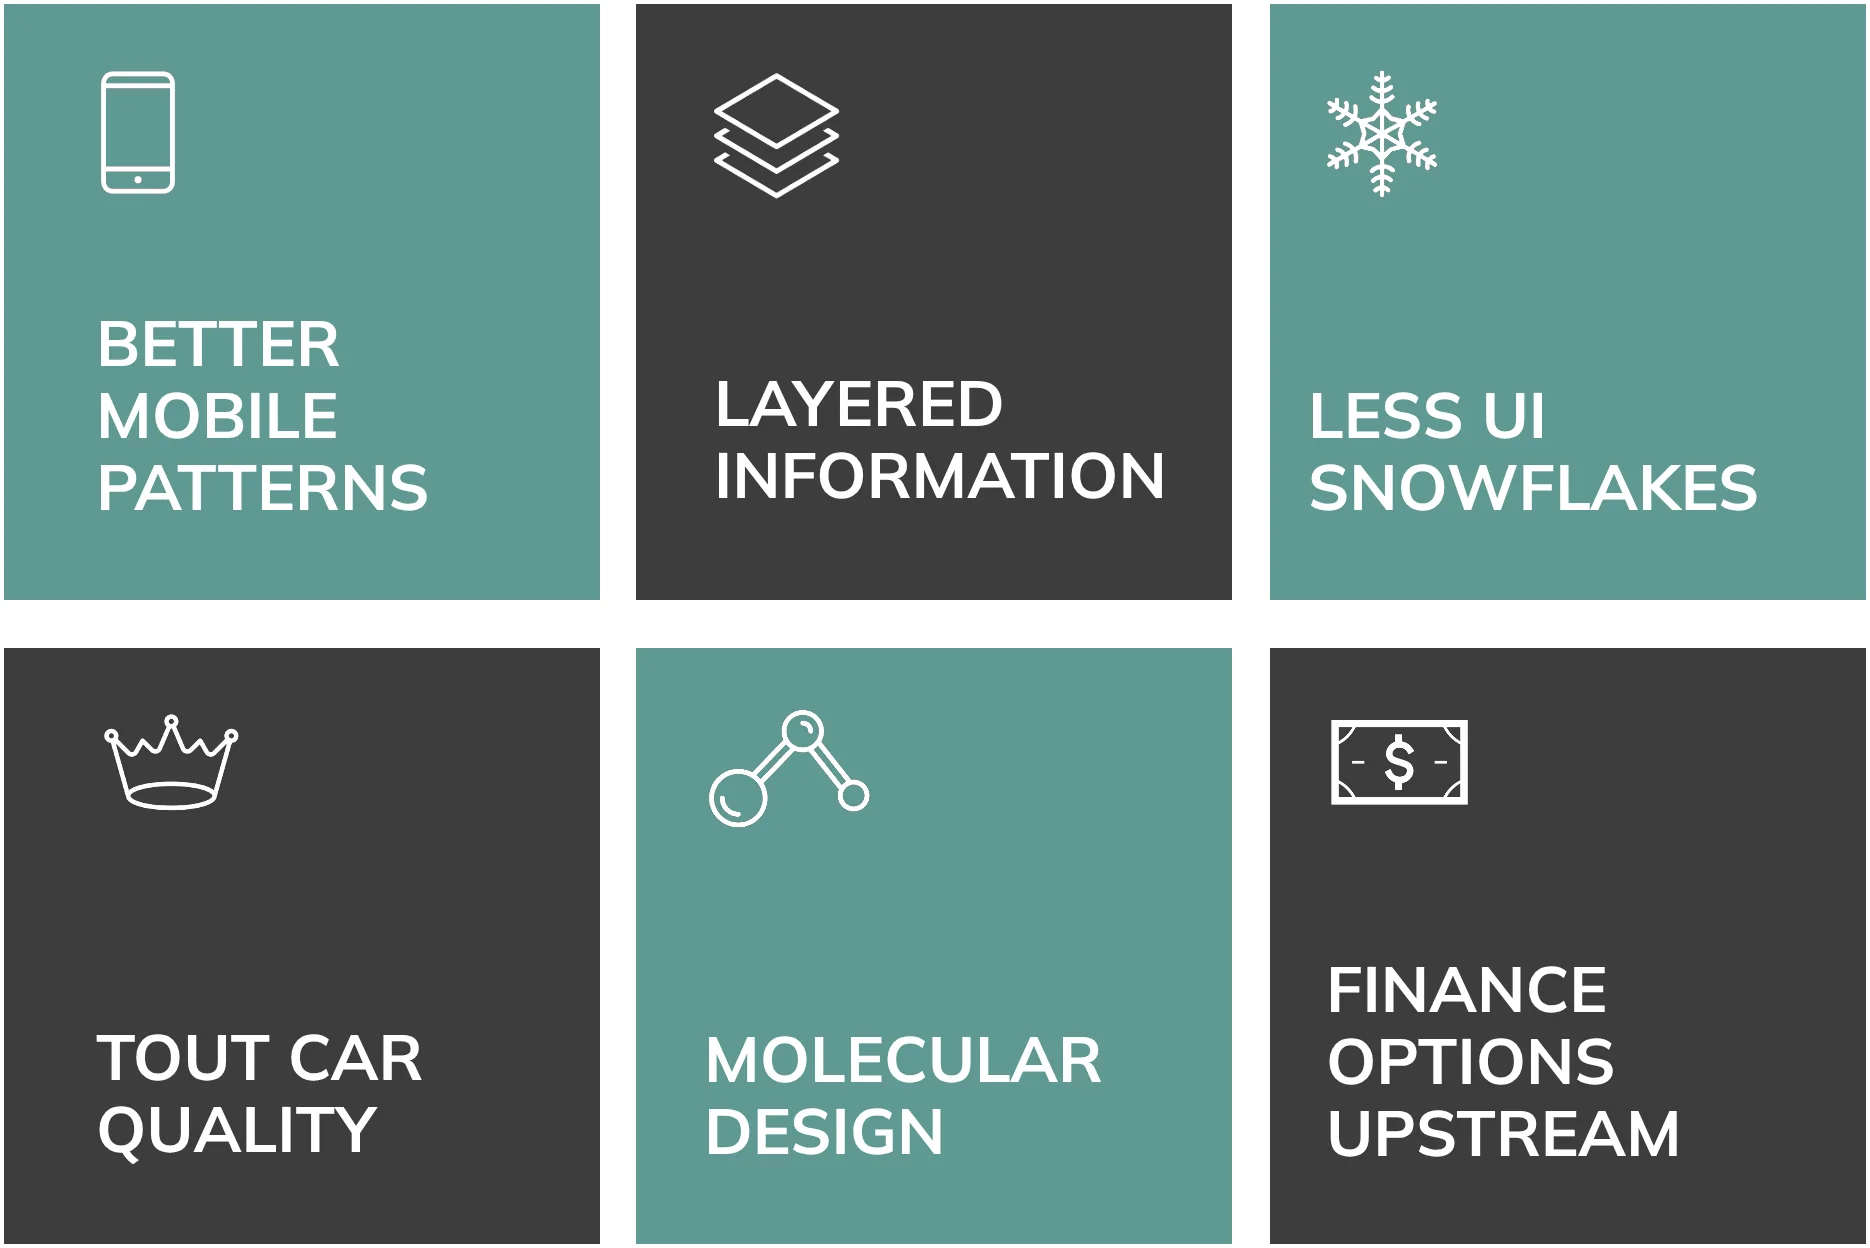
messaging opportunities. Here’s an aggregate of what stakeholders were hoping for.
Think about the Vehicle Detail Page as a platform, not
as a deployment.
– Josh
Director of Engineering
CRITICAL LENS
I tasked each of Carvana’s designers to audit the site against Jakob Nielsen’s usability heuristics. Together we grouped the findings into themes that guided the redesign.
Above: Carvana’s 360º experience lacked both hierarchy and clear calls to action. Iconography was accompanied by rollovers and
margin instructions.
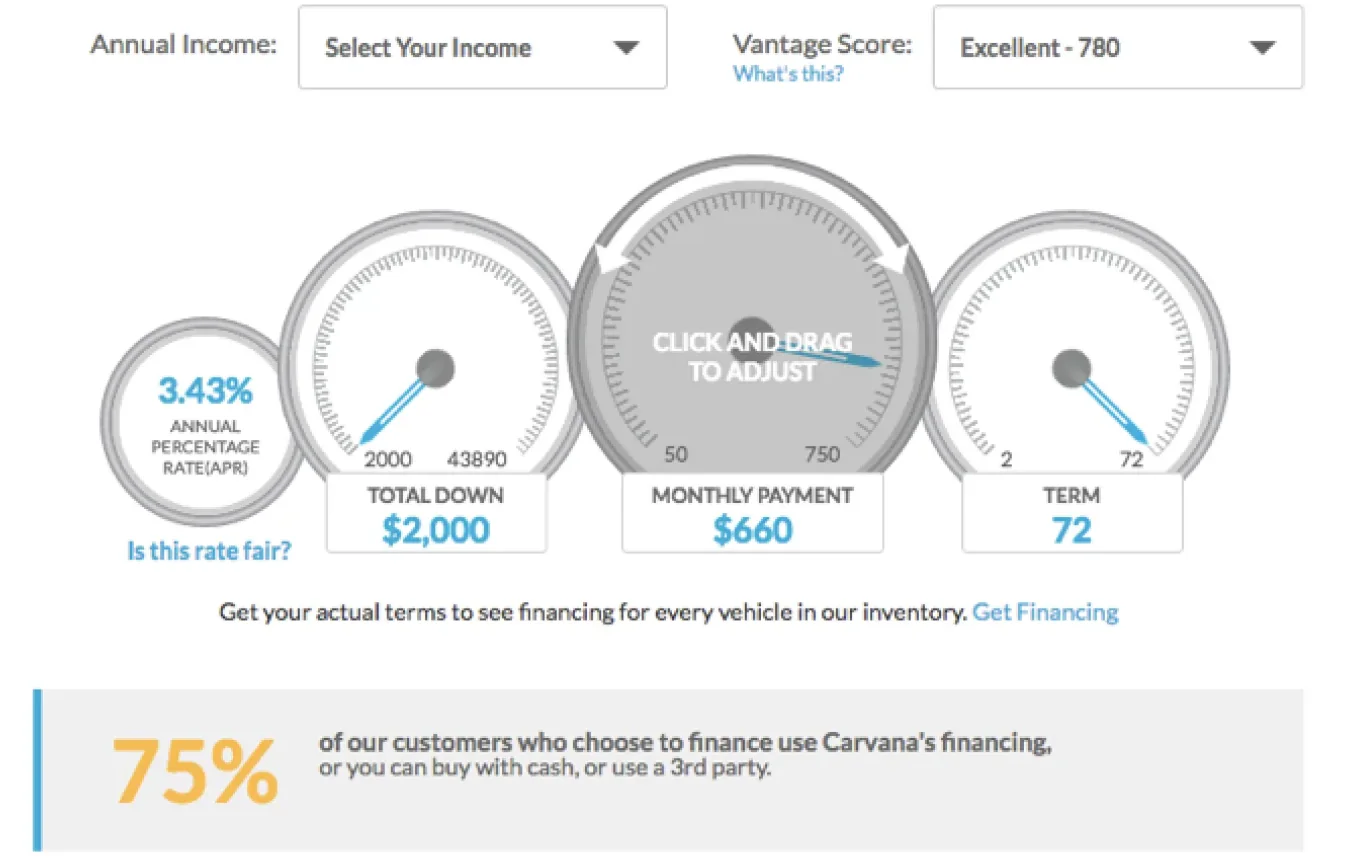
Above left: Even team members had trouble distinguishing the difference between section headers and tappable vehicle images.
Above right: Carvana’s finance calculator presented a fun metaphor but also challenged users with unexpected controls and a difficult
way input specific numbers.
User
control
& freedom
Consistency
& standards
Recognition
rather than
recall
A PEEK AT THE NUMBERS
With Carvana’s Analytics team, we analyzed where traffic came from and how customers moved through every core page.
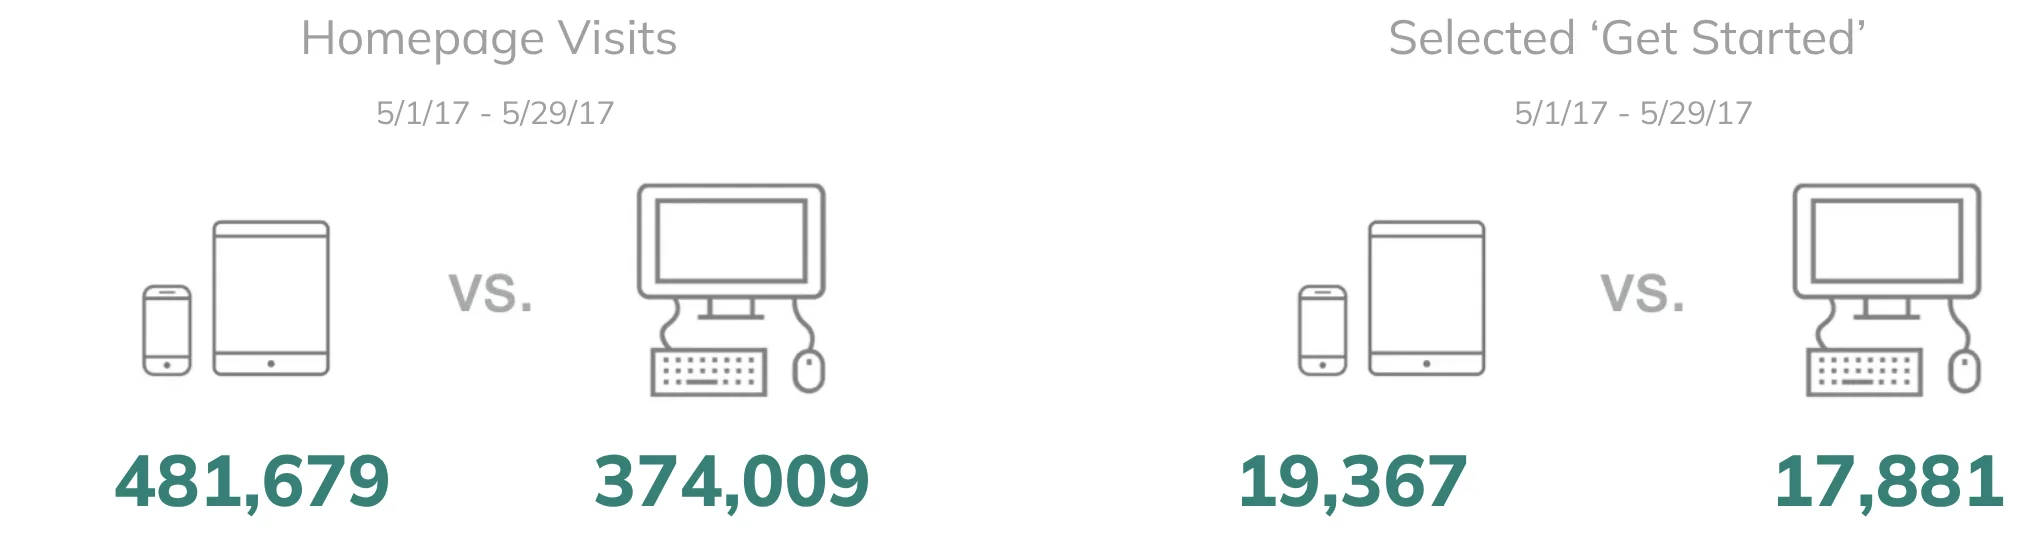
Above: Understanding macro analytics gave the team a knowledge base of user’s devices– where customers were coming from and
duration on key pages.
Total clicks on Vehicle Details Page SubNav
5/1/17 - 5/29/17
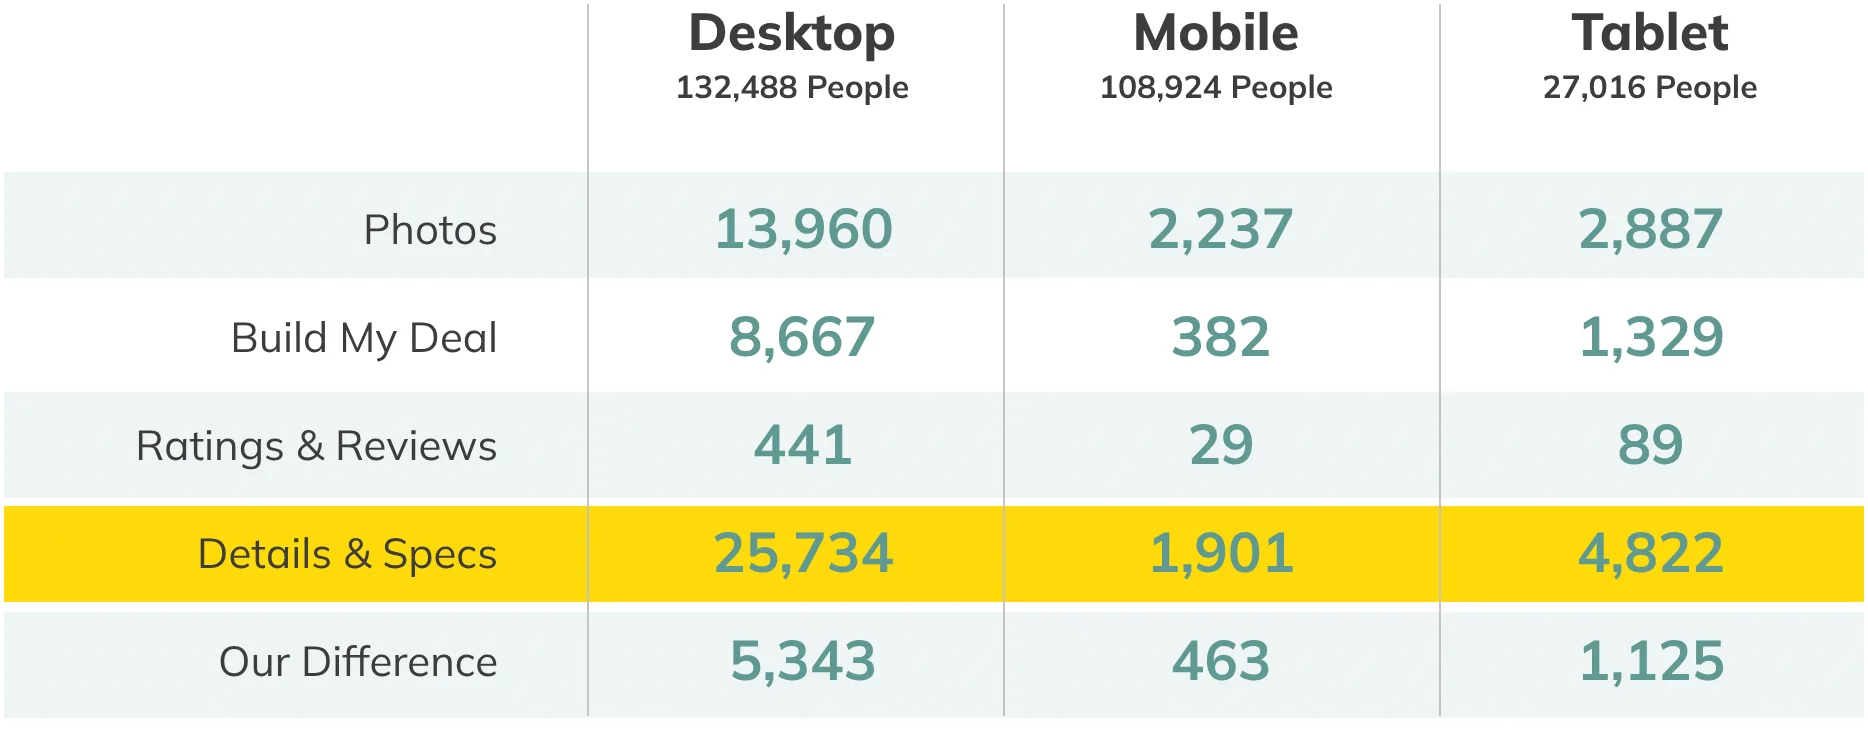
Above: Digging into flow analytics helped the team understand potential blockers. Here we saw little engagement with our Vehicle
Detail Page subnavigation on mobile. It also became clear that we needed to consider a different hierarchy with our highest engaged
module on the lower half of the screen.
Working with Product and Analytics, we also defined the KPIs the redesign would be measured against.
account creation
pre-qualifications
reservations
scheduled deliveries
appraisals
sales
EYE ON THE COMPETITION
Using usertesting.com, I had participants complete the same tasks on Carvana and three competitors. The results showed clear differences between our experience and theirs. Simultaneously, the team conducted competitive analyses of the same competitor sites.
4 of 5
Testers commented
about how much they
liked Shift’s hero images
“I’m just blown away by the huge picture”
“I can see a good, clear picture of the car”
“I am pleasantly surprised by the
image quality”
“I appreciate the quality of the pictures.”
Above: Improving our photography was one of the many signals the team received during competitive testing.
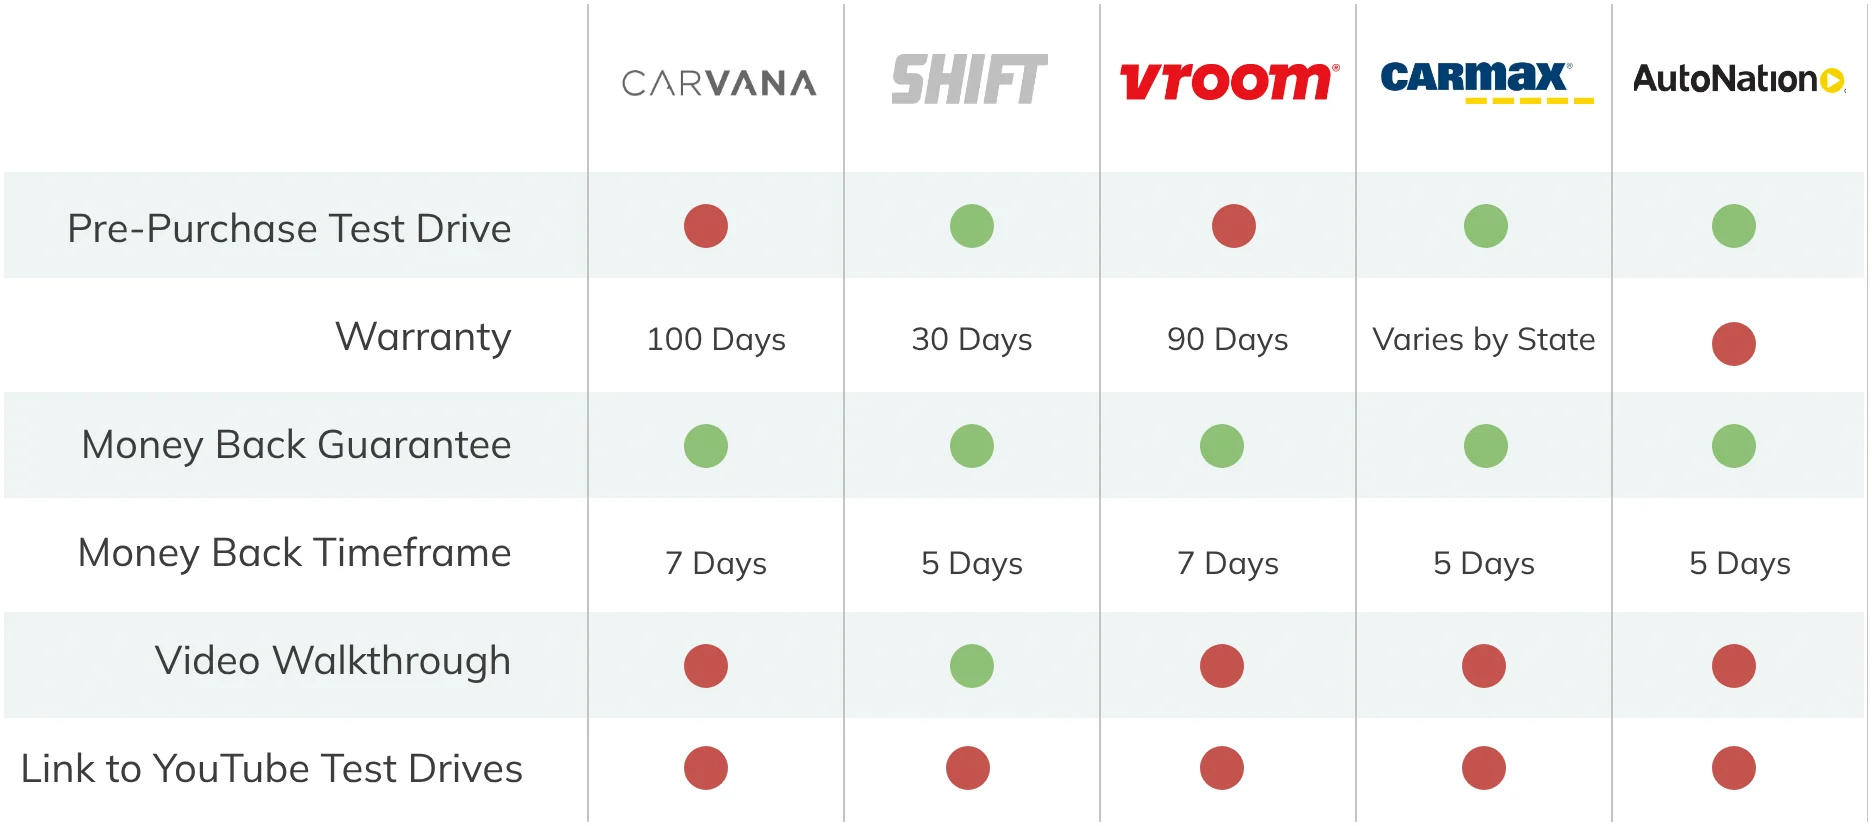
Above: A competitive analysis of value propositions
STAKEHOLDER WORKING SESSIONS
Over the course of two days, I led a cross functional group of stakeholders in a
series of generative brainstorming sessions. Team members were given a variety of
exercises. This included warm up exercises to get them prepared to think like users,
crazy eights and prompts in feature prioritization.
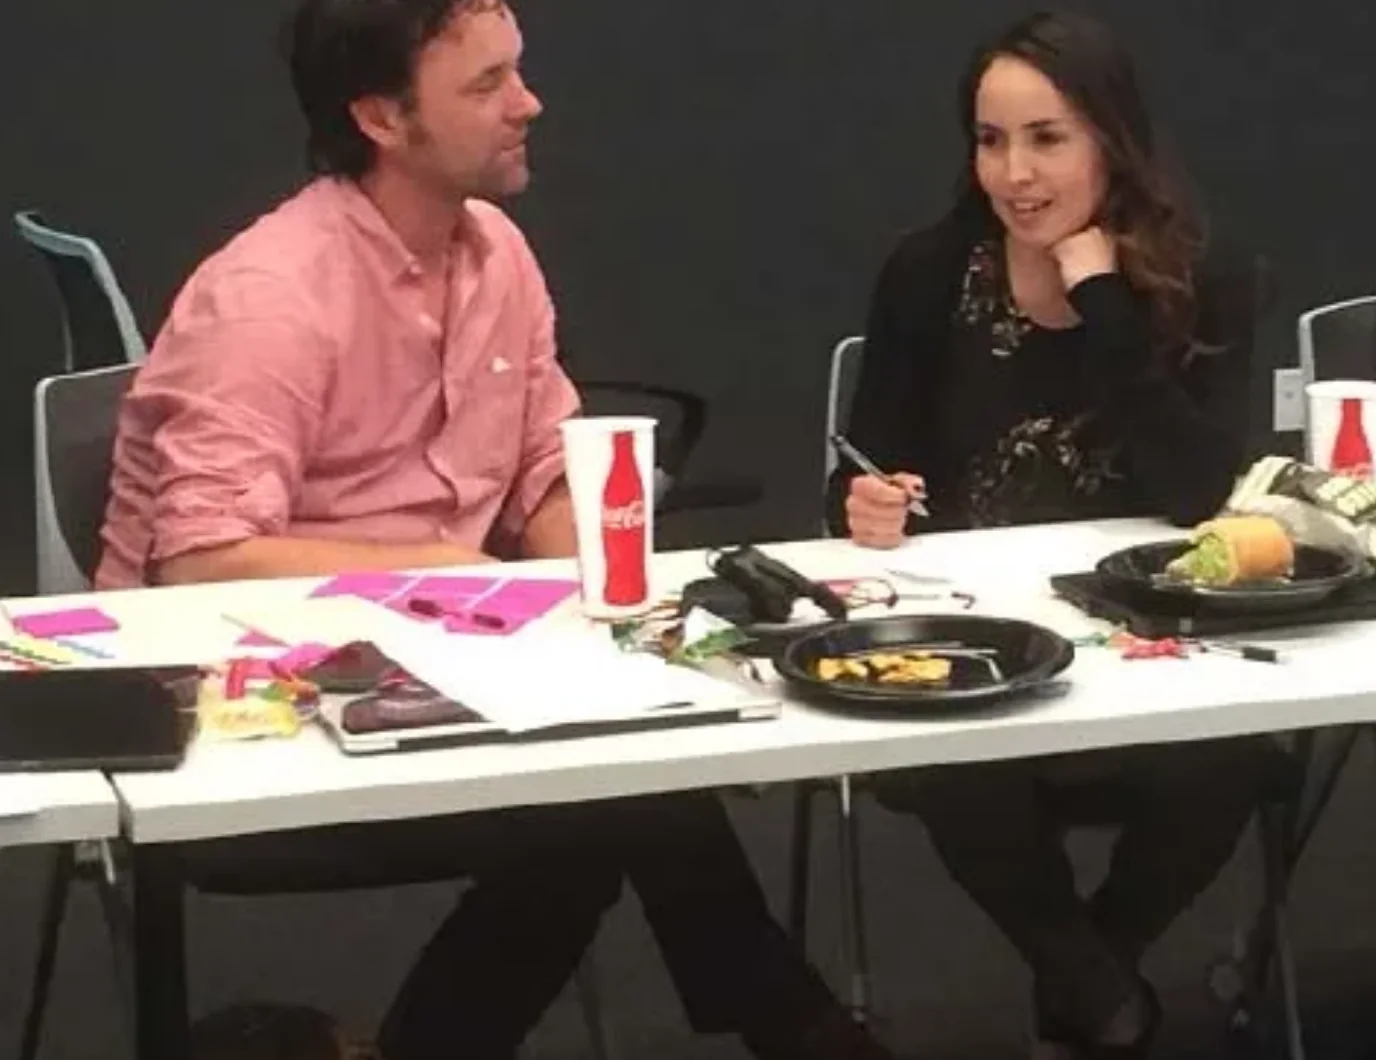
Above left: Team members sketch while enjoying lunch
Above right: Grouped themes of pains, gains and new ideas.
.
Stakeholders were given homework at the end of the first session. They were asked
to come back and share best in class experiences as well as provide examples of
subpar experiences on our site.
Above: A stakeholder’s example of best in class error messaging vs. Carvana.
Above : Examples of effective infographics paired with a 3 dimensional product.
DESIGN & TEST
After four weeks of learning, the team and I moved into sketches and wireframes, bringing product stakeholders in to whiteboard alongside us as we reworked navigation, features and hierarchy. We then updated the style guide, modernizing and consolidating existing patterns with accessibility in mind.
Above: Wireframes for a redesigned Vehicle Detail Page.
Above: Wireframes for a redesigned Search Results page.
Above: A Carvana customer scrolls through proposed categories using a prototype of Carvana’s homepage.
We tested clickable prototypes with InVision and usertesting.com, and built richer ones in Principle for in-person sessions. One finding changed our direction: participants remembered only a few of Carvana’s value propositions, so we added them in context throughout search and vehicle details.
LAUNCH OF KEY PAGES
With Home, Search and Vehicle Details being the first pages redesigned and tested,
the organization decided to develop and launch these first. This allowed us to
test the core experience in the wild and make needed changes prior to redesigning
all ancillary pages and launching everything at once.
Above: Version 2.0 of the homepage hero.
Above: Version 2.0 of Vehicle Details on the Vehicle Details Page.
SUCCESS METRICS
Over the course of several months, the design team tracked analytics and made a
few layout and functionality changes. Overall, the launch of our core pages was quite
successful and increased our main KPIs.
.4%
Increase in
Account Creations
2.6%
Increase in
Pre-Qualifications
4.3%
Increase in
Reservations
2.2%
Increase in
Scheduled Deliveries
1.4%
Increase in
Appraisals
.8%
Increase in Sales
KEY LEARNINGS
Working sessions with stakeholders are beneficial but the involvement of the user
early and often is more important
It’s just as important for developers to demo their work along the way as it is for
designers to present iterations
MVP should always be delightful
Happy paths are important. Unhappy paths are more important.
Handing a stakeholder a white board marker is often better than presenting
wireframes